

How to use this site and overview[Back to top]
For more information on how to use this site, please click here.
This site, ‘Japan’s Satellite Monitoring system of Agrometeorological Information’ (hereinafter referred to as “JASMAI” provides visualization of information related to the growth of grains and crops such as soil moisture content, precipitation, land surface temperature, solar radiation, vegetation index, land water index, evapotranspiration etc., for each country and area by obtaining agricultural meteorological data etc. obtained from satellite observation for the main production zones of major grains and other crops, through the public server etc. of the Japan Aerospace Exploration Agency (hereinafter referred to as "JAXA").
JASMAI has been developed and operated on a trial basis by JAXA and evaluated by MAFF based on the partnership agreement signed between MAFF and JAXA in 2011 to promote the use of satellite data for information gathering related to food security. Then, under a new partnership agreement ("Agreement on Promotion of Utilization of Earth Observation Satellite Data in the Field of Agriculture, Forestry and Fisheries") signed between the two organizations in 2019, JASMAI was rebuilt by the Ministry of Agriculture, Forestry and Fisheries (MAFF) with the cooperation of JAXA.
Data Overview[Back to top]
Data item[Back to top]
Soil moisture content, precipitation, Land surface temperature, solar radiation, vegetation index(NDVI: Normalized Difference Vegetation Index),snow-covered area(snow-covered area overlaid on soil moisture content map and vegetation index map),Data of unit yield etc.(planted area of crops, production, and unit yield), Land Water Index(LWI), Evapotranspiration(ET)
| Data source | Data Acquisition | Satellite sensor used | data period | |
|---|---|---|---|---|
| Soil moisture content | JAXA「AMSR2/AMSR-E Soil moisture content product」 | JAXA”G-Portal(Earth Observation Satellite Data Providing System)” | AMSR-E(Until September 2011. (on board NASA's Aqua satellite) AMSR2 (July 2012-present, on board JAXA's GCOM-W satellite) | January 2003 – Present(October 2011 - June 2012 , No data because neither AMSR-E nor AMSR-2 were operational) |
| Precipitation | JAXA「GSMaP Precipitation Product」 | JAXA「GSMaP(Satellite global precipitation map)」 | AMSR2(Onboard JAXA's GCOM-W satellite)、DPR (on NASA's GPM main satellite), etc. | January 2003 – Present(For daily and weekly precipitation maps, past two years to present) |
| Land surface temperature | JAXA "Surface Temperature Products" | JAXA "JASMES SGLI Standard Data (Global)" | SGLI (on JAXA's GCOM-C satellite) MODIS (on NASA's Terra satellite) | January 2003 to present (MODIS is used from January 2003 to August 2022, SGLI is used after September 2022) |
| Solar radiation | JAXA "Shortwave Radiation Products" | JAXA "JASMES SGLI Standard Data (Global)" | SGLI (on JAXA's GCOM-C satellite)MODIS (on NASA's Terra and Aqua satellites) | January 2003 to present (MODIS is used from January 2003 to August 2022, SGLI is used after September 2022 (SGLI is used only for April 2022)) |
| Vegetation index | JAXA "Vegetation Indicator (NDVI) Products" | JAXA "JASMES SGLI Standard Data (Global)" | SGLI (on JAXA's GCOM-C satellite) | January 2003 to present (MODIS is used from January 2003 to August 2022, SGLI is used after September 2022) |
| Snow-covered area | JAXA "Snow and Ice Area Product" | JAXA "JASMES SGLI Standard Data (Global)" | SGLI (on JAXA's GCOM-C satellite) | January 2003 to present (MODIS is used from January 2003 to August 2022, SGLI is used after September 2022) |
| Data on unit yield etc. (by country) | USDA”Production, Supply and Distribution | USDA Foreign Agricultural Service「PSD Online」 | - | January 2003 – Present |
| Data on unit yield etc.(by U.S. state) | USDA「National Agricultural Statistics Service」 | USDA NASS「Quick Stats」 | - | January 2003 - Present |
| Land Water Index | Land Water Index Product | JAXA「GSMaP(Satellite global precipitation map)」 | AMSR-E(Until September 2011. (on board NASA's Aqua satellite) AMSR2 (July 2012-present, on board JAXA's GCOM-W satellite) | January 2003 to present (MODIS is used from January 2003 to August 2022, SGLI is used after September 2022) |
| Evapotranspiration | Evapotranspiration Product | JAXA "JASMES SGLI Standard Data (Global)" | SGLI (on JAXA's GCOM-C satellite) | January 2003 to present (MODIS is used from January 2003 to August 2022, SGLI is used after September 2022) |
Data Display Format[Back to top]
a. Weather and vegetation map by semi-month(First half of each month:1st ~15 th, Second half of each month:16th~end of the month)
b. Monthly weather and vegetation map
c. Daily Precipitation Map
d. Weekly Precipitation Map
e. Weather and vegetation graph by area
f. Weather and vegetation graph by area and time period (averages, totalized value)
g. Graphs of unit yield etc.by area and commodity
h. CSV Data(Weather and vegetation graphs by area, weather and vegetation graphs by area and time period(Average, totalized value), Graphs of yield unit yield etc. by area and commodity)
Date of data update[Back to top]
Semi-monthly data: Data for the first half of each month (1st to 15th) will be updated sequentially from the 18th of the month (only precipitation will be updated from the 16th of the month).
Data for the second half of each month (from the 16th to the end of the month) will be updated sequentially from the 3rd of the following month (only precipitation data will be updated from the 1st of the following month).
Monthly data: Sequentially updated from the 3rd of the following month (only precipitation is updated from the 1st of the following month)
Daily and weekly precipitation data: updated after 14:00 of the following date
Data on unit yield etc.:Updated monthly from 12th to 16th of each month (only data by U.S. state is updated annually in November)
Please note that updates may be delayed depending on the status of satellite data distribution from JAXA and other sources.
Display mesh size for weather and vegetation maps[Back to top]
Weather and vegetation maps are mainly for overseas grain-growing areas (considered a major production area for wheat, rice, maize, and soybeans).
Soil Moisture Map, Precipitation Map: Latitude and longitude 0.1 degree mesh(Note1)
Land surface temperature map, Solar radiation map, Vegetation index map:Latitude and longitude 0.05 degree mesh(Note2)
Land Water Index map, Evapotranspiration map:Latitude and longitude 0.05 degree mesh(Note2)
Areas and items to be analyzed in the weather and vegetation graphs by area[Back to top]
The analysis areas in the area-specific weather and vegetation graphs are set up to cover what are considered to be the main production areas for wheat, rice, maize, and soybeans. Of all the meshes within each area, only those meshes that are considered to have cultivated area in 2018 based on land cover data (Note 3) are included in the analysis (Table 2). In addition, for some countries, such as Africa, the entire mesh of the entire country that is considered to have cultivated area in the land cover data in 2018 is set as the analysis target, regardless of the production areas of wheat, maize, and other crops.
| Area | Country | Zone | Wheat | Rice | Maize | Soybean | Crop Calendar Source. |
|---|---|---|---|---|---|---|---|
| North America | Canada | Alberta | ○ | - | ● | ● | Food Security Monthly Report |
| Saskatchewan | ○ | - | ● | ● | Food Security Monthly Report | ||
| Manitoba | ○ | - | ● | ○ | Food Security Monthly Report | ||
| Ontario | ● | - | ● | ○ | Food Security Monthly Report | ||
| USA | North Dakota | ○ | ● | ○ | ○ | AMIS Market Monitor | |
| South Dakota | ○ | ● | ○ | ○ | AMIS Market Monitor | ||
| Minnesota | ○ | ● | ○ | ○ | AMIS Market Monitor | ||
| Nebraska | ○ | ● | ○ | ○ | AMIS Market Monitor | ||
| Iowa | ● | ● | ○ | ○ | AMIS Market Monitor | ||
| Illinois | ○ | ● | ○ | ○ | AMIS Market Monitor | ||
| Indiana | ○ | ● | ○ | ○ | AMIS Market Monitor | ||
| Ohio | ○ | ● | ○ | ○ | AMIS Market Monitor | ||
| Kansas | ○ | ● | ○ | ○ | AMIS Market Monitor | ||
| Oklahoma | ○ | ● | ○ | ○ | AMIS Market Monitor | ||
| Texas | ○ | ● | ○ | ○ | AMIS Market Monitor | ||
| California | ○ | ○ | ○ | ● | AMIS Market Monitor | ||
| Washington | ○ | ● | ○ | ● | AMIS Market Monitor | ||
| Mexico | Mexico | Estado de Sinaloa | ● | ● | ● | ● | - |
| Estado de Jalisco | ● | ● | ● | ● | - | ||
| South America | Brazil | Estado de Mato Grosso | ● | ● | ○ | ○ | AMIS Market Monitor |
| Estado de Mato Grosso do Sul | ● | ● | ○ | ○ | AMIS Market Monitor | ||
| Estado do Parana | ● | ● | ○ | ○ | AMIS Market Monitor | ||
| Estado da Piaui | - | - | - | - | - | ||
| Estado da Marañón | - | - | - | - | - | ||
| Estado da Tocantins | ● | ● | ○ | ○ | - | ||
| Estado da Bahia | ● | ● | ● | ○ | AMIS Market Monitor | ||
| Estado do Rio Grande do Sul | ● | ● | ○ | ○ | AMIS Market Monitor | ||
| Argentina | Provincia de Buenos Aires | ○ | ● | ○ | ○ | AMIS Market Monitor | |
| Provincia de Cordoba | ○ | ● | ○ | ○ | AMIS Market Monitor | ||
| Provincia de Santa Fe | ○ | ● | ○ | ○ | AMIS Market Monitor | ||
| Panama | Panama Canal | - | - | - | - | - | |
| Australia | Australia | Queensland | ○ | ● | ● | ● | Food Security Monthly Report |
| New South Wales | ○ | ● | ● | ● | Food Security Monthly Report | ||
| Victoria | ○ | ● | ● | ● | Food Security Monthly Report | ||
| South Australia | ○ | ● | ● | ● | Food Security Monthly Report | ||
| Western Australia | ○ | ● | ● | ● | Food Security Monthly Report | ||
| Europe | France | Former Picardie Region | △ | - | △ | - | AMIS Market Monitor |
| Former Centre Region | △ | - | △ | - | AMIS Market Monitor | ||
| Southern France (former Aquitaine and Midi-Pyrenees Region) | △ | - | △ | - | AMIS Market Monitor | ||
| Germany | Freistaat Bayern | △ | - | △ | - | AMIS Market Monitor | |
| Land Niedersachsen | △ | - | △ | - | AMIS Market Monitor | ||
| Poland | Poland | △ | - | △ | - | AMIS Market Monitor | |
| Romania | Romania | △ | - | △ | - | AMIS Market Monitor | |
| Spain | Spain | △ | - | △ | - | AMIS Market Monitor | |
| Russia1/Ukraine | Russia1 | Central Federal District | ○ | ● | ● | ● | AMIS Market Monitor |
| Volga Federal District | ○ | ● | ● | ● | AMIS Market Monitor | ||
| Southern Federal District | ○ | ● | ● | ● | AMIS Market Monitor | ||
| North Caucasus Federal District | ○ | ● | ● | ● | AMIS Market Monitor | ||
| Ukraine | Black Sea coast | ○ | ● | ○ | ● | Food Security Monthly Report | |
| Eastern Ukraine | ○ | ● | ○ | ● | Food Security Monthly Report | ||
| Central and Eastern Ukraine | ○ | ● | ○ | ● | Food Security Monthly Report | ||
| Central Ukraine | ○ | ● | ○ | ● | Food Security Monthly Report | ||
| Russia2/Kazakhstan | Russia2 | Omsk | ○ | ● | ● | ● | AMIS Market Monitor |
| Kurgan | ○ | ● | ● | ● | AMIS Market Monitor | ||
| Altai region | ○ | ● | ● | ● | AMIS Market Monitor | ||
| Novosibirsk | ○ | ● | ● | ● | AMIS Market Monitor | ||
| Tyumen | ○ | ● | ● | ● | AMIS Market Monitor | ||
| Chelyabinsk | ○ | ● | ● | ● | AMIS Market Monitor | ||
| Kazakhstan | Kostanay Region | ○ | ● | ● | - | Food Security Monthly Report | |
| Northern Kazakhstan Region | ○ | ● | ● | - | Food Security Monthly Report | ||
| Akmola Region | ○ | ● | ● | - | Food Security Monthly Report | ||
| Pavlodar Region | ○ | ● | ● | - | Food Security Monthly Report | ||
| East Kazakhstan Region | ○ | ● | ● | - | Food Security Monthly Report | ||
| Eastern China | Eastern China | Anhui | ○ | ○ | ○ | ● | AMIS Market Monitor |
| Hubei | ○ | ○ | ○ | ● | AMIS Market Monitor | ||
| Hunan | ○ | ○ | ○ | ● | AMIS Market Monitor | ||
| Jiangxi | ○ | ○ | ○ | ● | AMIS Market Monitor | ||
| Henan | ○ | ○ | ○ | ● | AMIS Market Monitor | ||
| Shandong | ○ | ○ | ○ | ● | AMIS Market Monitor | ||
| Jiangsu | ○ | ○ | ○ | ● | AMIS Market Monitor | ||
| Hebei | ○ | ○ | ○ | ● | AMIS Market Monitor | ||
| Sichuan | ○ | ○ | ○ | ● | AMIS Market Monitor | ||
| Guangdong | ○ | ○ | ○ | ● | AMIS Market Monitor | ||
| Chongqing | ○ | ○ | ○ | ● | AMIS Market Monitor | ||
| Russia3/ Northeast China | Northeastern China | Heilongjiang | ○ | ○ | ○ | ○ | AMIS Market Monitor |
| Jilin | ○ | ○ | ○ | ○ | AMIS Market Monitor | ||
| Liaoning | ○ | ○ | ○ | ○ | AMIS Market Monitor | ||
| Inner Mongolia | ○ | ○ | ○ | ○ | AMIS Market Monitor | ||
| Russia3 | Amur Oblast | ● | ● | ● | ○ | Food Security Monthly Report | |
| South Asia | India | Rajasthan | ○ | ○ | ● | ○ | AMIS Market Monitor |
| Madhya Pradesh | ○ | ○ | ● | ○ | AMIS Market Monitor | ||
| Punjab | ○ | ○ | ● | ● | AMIS Market Monitor | ||
| Haryana | ○ | ○ | ● | ● | AMIS Market Monitor | ||
| Uttar Pradesh | ○ | ○ | ● | ○ | AMIS Market Monitor | ||
| West Bengal | ○ | ○ | ● | ○ | AMIS Market Monitor | ||
| Maharashtra | ○ | ○ | ● | ○ | AMIS Market Monitor | ||
| Karnataka | ○ | ○ | ● | ○ | AMIS Market Monitor | ||
| Telangana/Andhra Pradesh | ○ | ○ | ● | ○ | AMIS Market Monitor | ||
| Pakistan | Punjab | ● | ○ | ● | ● | Food Security Monthly Report | |
| Bangladesh | Bangladesh | ● | ● | ● | ● | - | |
| Southeast Asia | Thailand Northern | Chiang Mai | - | - | - | - | - |
| Chiang Rai | - | - | - | - | - | ||
| Lampang | - | - | - | - | - | ||
| Lamphun | - | - | - | - | - | ||
| Mae Hong Son | - | - | - | - | - | ||
| Nan | - | - | - | - | - | ||
| Phayao | - | - | - | - | - | ||
| Phrae | - | - | - | - | - | ||
| Uttaradit | - | - | - | - | - | ||
| Tak | - | - | - | - | - | ||
| Kamphaeng Phet | - | - | - | - | - | ||
| Phetchabun | - | - | - | - | - | ||
| Phichit | - | - | - | - | - | ||
| Phitsanulok | - | - | - | - | - | ||
| Sukhothai | - | - | - | - | - | ||
| Nakhon Sawan | - | - | - | - | - | ||
| Uthai Thani | - | - | - | - | - | ||
| Thailand Northeastern | Amnat Charoen | - | - | - | - | - | |
| Bueng Kan | - | - | - | - | - | ||
| Buri Ram | - | - | - | - | - | ||
| Chaiyaphum | - | - | - | - | - | ||
| Kalasin | - | - | - | - | - | ||
| Khon Kaen | - | - | - | - | - | ||
| Loei | - | - | - | - | - | ||
| Maha Sarakham | - | - | - | - | - | ||
| Mukdahan | - | - | - | - | - | ||
| Nakhon Phanom | - | - | - | - | - | ||
| Nakhon Ratchasima | - | - | - | - | - | ||
| Nong Bua Lamphu | - | - | - | - | - | ||
| Nong Khai | - | - | - | - | - | ||
| Roi Et | - | - | - | - | - | ||
| Sakon Nakhon | - | - | - | - | - | ||
| Si Sa Ket | - | - | - | - | - | ||
| Surin | - | - | - | - | - | ||
| Ubon Ratchathani | - | - | - | - | - | ||
| Udon Thani | - | - | - | - | - | ||
| Yasothon | - | - | - | - | - | ||
| Thailand Central | Ang Thong | - | - | - | - | - | |
| Bangkok | - | - | - | - | - | ||
| Chai Nat | - | - | - | - | - | ||
| Lop Buri | - | - | - | - | - | ||
| Nakhon Pathom | - | - | - | - | - | ||
| Nonthaburi | - | - | - | - | - | ||
| Pathum Thani | - | - | - | - | - | ||
| Phra Nakhon Si Ayutthaya | - | - | - | - | - | ||
| Samut Prakan | - | - | - | - | - | ||
| Samut Sakhon | - | - | - | - | - | ||
| Samut Songkhram | - | - | - | - | - | ||
| Saraburi | - | - | - | - | - | ||
| Sing Buri | - | - | - | - | - | ||
| Suphan Buri | - | - | - | - | - | ||
| Kanchanaburi | - | - | - | - | - | ||
| Ratchaburi | - | - | - | - | - | ||
| Phetchaburi | - | - | - | - | - | ||
| Prachuap Khiri Khan | - | - | - | - | - | ||
| Nakhon Nayok | - | - | - | - | - | ||
| Chachoengsao | - | - | - | - | - | ||
| Chanthaburi | - | - | - | - | - | ||
| Chon Buri | - | - | - | - | - | ||
| Prachin Buri | - | - | - | - | - | ||
| Rayong | - | - | - | - | - | ||
| Sa Kaeo | - | - | - | - | - | ||
| Trat | - | - | - | - | - | ||
| Thailand Southern | Chumphon | - | - | - | - | - | |
| Nakhon Si Thammarat | - | - | - | - | - | ||
| Narathiwat | - | - | - | - | - | ||
| Pattani | - | - | - | - | - | ||
| Phatthalung | - | - | - | - | - | ||
| Songkhla | - | - | - | - | - | ||
| Surat Thani | - | - | - | - | - | ||
| Yala | - | - | - | - | - | ||
| Krabi | - | - | - | - | - | ||
| Phang Nga | - | - | - | - | - | ||
| Phuket | - | - | - | - | - | ||
| Ranong | - | - | - | - | - | ||
| Satun | - | - | - | - | - | ||
| Trang | - | - | - | - | - | ||
| Vietnam North Central and Central coastal area | Thanh Hoa | - | - | - | - | - | |
| Nghe An | - | - | - | - | - | ||
| Ha Tinh | - | - | - | - | - | ||
| Quang Binh | - | - | - | - | - | ||
| Quang Tri | - | - | - | - | - | ||
| Thua Thien Hue | - | - | - | - | - | ||
| Da Nang | - | - | - | - | - | ||
| Quang Nam | - | - | - | - | - | ||
| Quang Ngai | - | - | - | - | - | ||
| Binh Dinh | - | - | - | - | - | ||
| Phu Yen | - | - | - | - | - | ||
| Khanh Hoa | - | - | - | - | - | ||
| Ninh Thuan | - | - | - | - | - | ||
| Binh Thuan | - | - | - | - | - | ||
| Vietnam Northern midlands and mountain areas | Ha Giang | - | - | - | - | - | |
| Cao Bang | - | - | - | - | - | ||
| Bac Kan | - | - | - | - | - | ||
| Tuyen Quang | - | - | - | - | - | ||
| Lao Cai | - | - | - | - | - | ||
| Yen Bai | - | - | - | - | - | ||
| Thai Nguyen | - | - | - | - | - | ||
| Lang Son | - | - | - | - | - | ||
| Bac Giang | - | - | - | - | - | ||
| Phu Tho | - | - | - | - | - | ||
| Dien Bien | - | - | - | - | - | ||
| Lai Chau | - | - | - | - | - | ||
| Son La | - | - | - | - | - | ||
| Hoa Binh | - | - | - | - | - | ||
| Vietnam Red River Delta | Ha Noi | - | - | - | - | - | |
| Vinh Phuc | - | - | - | - | - | ||
| Bac Ninh | - | - | - | - | - | ||
| Quang Ninh | - | - | - | - | - | ||
| Hai Duong | - | - | - | - | - | ||
| Hai Phong | - | - | - | - | - | ||
| Hung Yen | - | - | - | - | - | ||
| Thai Binh | - | - | - | - | - | ||
| Ha Nam | - | - | - | - | - | ||
| Nam Dinh | - | - | - | - | - | ||
| Ninh Binh | - | - | - | - | - | ||
| Vietnam Central Highlands | Kon Tum | - | - | - | - | - | |
| Gia Lai | - | - | - | - | - | ||
| Dak Lak | - | - | - | - | - | ||
| Dak Nong | - | - | - | - | - | ||
| Lam Dong | - | - | - | - | - | ||
| Vietnam South East | Binh Phuoc | - | - | - | - | - | |
| Tay Ninh | - | - | - | - | - | ||
| Binh Duong | - | - | - | - | - | ||
| Dong Nai | - | - | - | - | - | ||
| Ba Ria Vung Tau | - | - | - | - | - | ||
| Ho Chi Minh | - | - | - | - | - | ||
| Vietnam Mekong River Delta | Long An | - | - | - | - | - | |
| Tien Giang | - | - | - | - | - | ||
| Ben Tre | - | - | - | - | - | ||
| Tra Vinh | - | - | - | - | - | ||
| Vinh Long | - | - | - | - | - | ||
| Dong Thap | - | - | - | - | - | ||
| An Giang | - | - | - | - | - | ||
| Kien Giang | - | - | - | - | - | ||
| Can Tho | - | - | - | - | - | ||
| Hau Giang | - | - | - | - | - | ||
| Soc Trang | - | - | - | - | - | ||
| Bac Lieu | - | - | - | - | - | ||
| Ca Mau | - | - | - | - | - | ||
| Myanmar | Chin | - | - | - | - | - | |
| Kachin | - | - | - | - | - | ||
| Kayah | - | - | - | - | - | ||
| Kayin | - | - | - | - | - | ||
| Mon | - | - | - | - | - | ||
| Rakhine | - | - | - | - | - | ||
| Shan | - | - | - | - | - | ||
| Yangon | - | - | - | - | - | ||
| Ayeyawady | - | - | - | - | - | ||
| Bago | - | - | - | - | - | ||
| Magway | - | - | - | - | - | ||
| Mandalay | - | - | - | - | - | ||
| Sagaing | - | - | - | - | - | ||
| Tanintharyi | - | - | - | - | - | ||
| Cambodia Northern | Odar Meanchey | - | - | - | - | - | |
| Preah Vihear | - | - | - | - | - | ||
| Stung Treng | - | - | - | - | - | ||
| Cambodia Northwest | Banteay Menachey | - | - | - | - | - | |
| Cambodia Northeast | Ratanak Kiri | - | - | - | - | - | |
| Cambodia Central | Phnom Penh | - | - | - | - | - | |
| Kampong Cham | - | - | - | - | - | ||
| Kampong Chhnang | - | - | - | - | - | ||
| Kampong Thom | - | - | - | - | - | ||
| Kampong Speu | - | - | - | - | - | ||
| Siem Reap | - | - | - | - | - | ||
| Cambodia East | Mondul Kiri | - | - | - | - | - | |
| Kratie | - | - | - | - | - | ||
| Cambodia Southern and Coast | Svay Rieng | - | - | - | - | - | |
| Prey Veng | - | - | - | - | - | ||
| Kandal | - | - | - | - | - | ||
| Takeo | - | - | - | - | - | ||
| Kampot | - | - | - | - | - | ||
| Kep | - | - | - | - | - | ||
| Sihaoukville | - | - | - | - | - | ||
| Cambodia West and Coast | Koh Kong | - | - | - | - | - | |
| Pursat | - | - | - | - | - | ||
| Battambang | - | - | - | - | - | ||
| Pailin | - | - | - | - | - | ||
| Indonesia Sumatera Island | Nangroe Aceh Darussalam | - | - | - | - | - | |
| North Sumatera | - | - | - | - | - | ||
| West Sumatera | - | - | - | - | - | ||
| Riau | - | - | - | - | - | ||
| Bengkulu | - | - | - | - | - | ||
| Jambi | - | - | - | - | - | ||
| Lampung | - | - | - | - | - | ||
| South Sumatera | - | - | - | - | - | ||
| Riau Archipelago | - | - | - | - | - | ||
| Bangka Belitung Archipelago | - | - | - | - | - | ||
| Indonesia Kalimantan Island | West Kalimantan | - | - | - | - | - | |
| Central Kalimantan | - | - | - | - | - | ||
| East Kalimantan | - | - | - | - | - | ||
| North Kalimantan | - | - | - | - | - | ||
| South Kalimantan | - | - | - | - | - | ||
| Indonesia Sulawesi Island | South Sulawesi | - | - | - | - | - | |
| Central Sulawesi | - | - | - | - | - | ||
| West Sulawesi | - | - | - | - | - | ||
| North Sulawesi | - | - | - | - | - | ||
| Gorontalo | - | - | - | - | - | ||
| South East Sulawesi | - | - | - | - | - | ||
| Indonesia Maluku and North Maluku Islands | Maluku | - | - | - | - | - | |
| North Maluku | - | - | - | - | - | ||
| Indonesia Papua Island | West Papua | - | - | - | - | - | |
| Papua | - | - | - | - | - | ||
| Indonesia Java Island | East Java | - | - | - | - | - | |
| Central Java | - | - | - | - | - | ||
| West Java | - | - | - | - | - | ||
| DI. Yogyakarta | - | - | - | - | - | ||
| DKI Jakarta | - | - | - | - | - | ||
| Banten | - | - | - | - | - | ||
| Indonesia Bali, West Nusa Tenggara, and East Nusa Tenggara Islands | Bali | - | - | - | - | - | |
| West Nusa Tenggara | - | - | - | - | - | ||
| East Nusa Tenggara | - | - | - | - | - | ||
| Philippines NCR | Caloocan | - | - | - | - | - | |
| Las Pinas | - | - | - | - | - | ||
| Makati | - | - | - | - | - | ||
| Malabon | - | - | - | - | - | ||
| Mandaluyong City | - | - | - | - | - | ||
| Manila | - | - | - | - | - | ||
| Marikina | - | - | - | - | - | ||
| Muntinlupa | - | - | - | - | - | ||
| Navotas | - | - | - | - | - | ||
| Paranaque | - | - | - | - | - | ||
| Pasay | - | - | - | - | - | ||
| Pasig | - | - | - | - | - | ||
| Pateros | - | - | - | - | - | ||
| Quezon City | - | - | - | - | - | ||
| San Juan | - | - | - | - | - | ||
| Taguig | - | - | - | - | - | ||
| Valenzuela | - | - | - | - | - | ||
| Philippines CAR | Abra | - | - | - | - | - | |
| Apayao | - | - | - | - | - | ||
| Benguet | - | - | - | - | - | ||
| Ifugao | - | - | - | - | - | ||
| Kalinga | - | - | - | - | - | ||
| Mountain Province | - | - | - | - | - | ||
| City of Baguio | - | - | - | - | - | ||
| Philippines Ilocos Region | Ilocos Norte | - | - | - | - | - | |
| Ilocos Sur | - | - | - | - | - | ||
| La Union | - | - | - | - | - | ||
| Pangasinan | - | - | - | - | - | ||
| Dagupan | - | - | - | - | - | ||
| Philippines Cagayan Valley | Batanes | - | - | - | - | - | |
| Cagayan | - | - | - | - | - | ||
| Isabela | - | - | - | - | - | ||
| Nueva Vizcaya | - | - | - | - | - | ||
| Quirino | - | - | - | - | - | ||
| Santiago | - | - | - | - | - | ||
| Philippines Central Luzon | Aurora | - | - | - | - | - | |
| Bataan | - | - | - | - | - | ||
| Bulacan | - | - | - | - | - | ||
| Nueva Ecija | - | - | - | - | - | ||
| Pampanga | - | - | - | - | - | ||
| Tarlac | - | - | - | - | - | ||
| Zambales | - | - | - | - | - | ||
| City of Angeles | - | - | - | - | - | ||
| City of Olongapo | - | - | - | - | - | ||
| Philippines CALABARZON | Batangas | - | - | - | - | - | |
| Cavite | - | - | - | - | - | ||
| Laguna | - | - | - | - | - | ||
| Quezon | - | - | - | - | - | ||
| Rizal | - | - | - | - | - | ||
| City of Lucena | - | - | - | - | - | ||
| Philippines MIMAROPA Region | Marinduque | - | - | - | - | - | |
| Occidental Mindoro | - | - | - | - | - | ||
| Oriental Mindoro | - | - | - | - | - | ||
| Palawan | - | - | - | - | - | ||
| Romblon | - | - | - | - | - | ||
| City of Puerto Princesa | - | - | - | - | - | ||
| Philippines Bicol Region | Albay | - | - | - | - | - | |
| Camarines Norte | - | - | - | - | - | ||
| Camarines Sur | - | - | - | - | - | ||
| Catanduanes | - | - | - | - | - | ||
| Masbate | - | - | - | - | - | ||
| Sorsogon | - | - | - | - | - | ||
| Naga | - | - | - | - | - | ||
| Philippines Western Visayas | Aklan | - | - | - | - | - | |
| Antique | - | - | - | - | - | ||
| Capiz | - | - | - | - | - | ||
| Guimaras | - | - | - | - | - | ||
| Iloilo | - | - | - | - | - | ||
| Negros Occidental | - | - | - | - | - | ||
| City of Bacolod | - | - | - | - | - | ||
| City of Iloilo | - | - | - | - | - | ||
| Philippines Central Visayas | Bohol | - | - | - | - | - | |
| Cebu | - | - | - | - | - | ||
| Negros Oriental | - | - | - | - | - | ||
| Siquijor | - | - | - | - | - | ||
| City of Cebu | - | - | - | - | - | ||
| City of Lapu-Lapu | - | - | - | - | - | ||
| City of Mandaue | - | - | - | - | - | ||
| Philippines Eastern Visayas | Biliran | - | - | - | - | - | |
| Eastern Samar | - | - | - | - | - | ||
| Leyte | - | - | - | - | - | ||
| Northern Samar | - | - | - | - | - | ||
| Samar | - | - | - | - | - | ||
| Southern Leyte | - | - | - | - | - | ||
| City of Tacloban | - | - | - | - | - | ||
| Ormoc | - | - | - | - | - | ||
| Philippines Zamboanga Peninsula | Zamboanga del Norte | - | - | - | - | - | |
| Zamboanga del Sur | - | - | - | - | - | ||
| Zamboanga Sibugay | - | - | - | - | - | ||
| City of Isabela | - | - | - | - | - | ||
| City of Zamboanga | - | - | - | - | - | ||
| Philippines Northern Mindanao | Bukidnon | - | - | - | - | - | |
| Camiguin | - | - | - | - | - | ||
| Lanao del Norte | - | - | - | - | - | ||
| Misamis Occidental | - | - | - | - | - | ||
| Misamis Oriental | - | - | - | - | - | ||
| City of Cagayan de Oro | - | - | - | - | - | ||
| City of Iligan | - | - | - | - | - | ||
| Philippines Davao Region | Davao de Oro | - | - | - | - | - | |
| Davao del Norte | - | - | - | - | - | ||
| Davao del Sur | - | - | - | - | - | ||
| Davao Oriental | - | - | - | - | - | ||
| City of Davao | - | - | - | - | - | ||
| Philippines SOCCSKSARGEN | Cotabato | - | - | - | - | - | |
| Sarangani | - | - | - | - | - | ||
| South Cotabato | - | - | - | - | - | ||
| Sultan Kudarat | - | - | - | - | - | ||
| City of General Santos | - | - | - | - | - | ||
| Philippines BARMM | Basilan | - | - | - | - | - | |
| Lanao del Sur | - | - | - | - | - | ||
| Maguindanao | - | - | - | - | - | ||
| Sulu | - | - | - | - | - | ||
| Tawi-tawi | - | - | - | - | - | ||
| Philippines Caraga | Agusan del Norte | - | - | - | - | - | |
| Agusan del Sur | - | - | - | - | - | ||
| Dinagat Islands | - | - | - | - | - | ||
| Surigao del Norte | - | - | - | - | - | ||
| Surigao del Sur | - | - | - | - | - | ||
| City of Butuan | - | - | - | - | - | ||
| Lao PDR Northern | Phongsaly | - | - | - | - | - | |
| Luangnamtha | - | - | - | - | - | ||
| Oudomxay | - | - | - | - | - | ||
| Bokeo | - | - | - | - | - | ||
| Luangprabang | - | - | - | - | - | ||
| Huaphanh | - | - | - | - | - | ||
| Xayabury | - | - | - | - | - | ||
| Lao PDR Central | Vientiane Capital | - | - | - | - | - | |
| Xiengkhuang | - | - | - | - | - | ||
| Vientiane | - | - | - | - | - | ||
| Borikhamxay | - | - | - | - | - | ||
| Khammuane | - | - | - | - | - | ||
| Savannakhet | - | - | - | - | - | ||
| Lao PDR Southern | Saravan | - | - | - | - | - | |
| Sekong | - | - | - | - | - | ||
| Champasack | - | - | - | - | - | ||
| Attapeu | - | - | - | - | - | ||
| Malaysia West Malaysia (Peninsular Malaysia) | Perlis | - | - | - | - | - | |
| Kedah | - | - | - | - | - | ||
| Penang | - | - | - | - | - | ||
| Perak | - | - | - | - | - | ||
| Selangor | - | - | - | - | - | ||
| Negeri Sembilan | - | - | - | - | - | ||
| Malacca | - | - | - | - | - | ||
| Johore | - | - | - | - | - | ||
| Pahang | - | - | - | - | - | ||
| Terengganu | - | - | - | - | - | ||
| Kelantan | - | - | - | - | - | ||
| Federal Territory Kuala Lumpur | - | - | - | - | - | ||
| Federal Territory Putrajaya | - | - | - | - | - | ||
| Malaysia East Malaysia | Sabah | - | - | - | - | - | |
| Sarawak | - | - | - | - | - | ||
| Federal Territory Labuan | - | - | - | - | - | ||
| Brunei | Belait | - | - | - | - | - | |
| Brunei-Muara | - | - | - | - | - | ||
| Temburong | - | - | - | - | - | ||
| Tutong | - | - | - | - | - | ||
| Singapore | Singapore | - | - | - | - | - | |
| Timor Leste | Dili | - | - | - | - | - | |
| Manatuto | - | - | - | - | - | ||
| Liquica | - | - | - | - | - | ||
| Baucau | - | - | - | - | - | ||
| Viqueque | - | - | - | - | - | ||
| Lautem | - | - | - | - | - | ||
| Ainaro | - | - | - | - | - | ||
| Aileu | - | - | - | - | - | ||
| Manufahi | - | - | - | - | - | ||
| Ermera | - | - | - | - | - | ||
| Cova Lima | - | - | - | - | - | ||
| Bobonaro | - | - | - | - | - | ||
| Oecussi Ambeno | - | - | - | - | - | ||
| Northern Africa | Egypt | Egypt | ● | ● | ● | ● | - |
| Ethiopia | Ethiopia | ● | ● | ● | ● | - | |
| Nigeria | Nigeria | ● | ● | ● | ● | - | |
| Senegal | Senegal | - | - | - | - | - | |
| Southern Africa | Kenya | Kenya | ● | ● | ● | - | - |
| Uganda | Uganda | ● | ● | ● | ● | - | |
| Tanzania | Tanzania | ● | ● | ● | - | - | |
| Madagascar | Madagascar | - | ● | ● | - | - | |
| South Africa | Free State | ● | - | ● | ● | - | |
| Mpumalanga Province | ● | - | ● | ● | - | ||
| Northwest Province | ● | - | ● | ● | - |
Normal value calculation method[Back to top]
Normal values are calculated using data for the period January 2013 through December 2019. The normal value is calculated for each mesh by averaging or summing the data for each mesh for each data item using the method shown in Table 3.(See 2(4) for the mesh of each data item.)
| Item | Mesh-by-mesh normal value calculation method |
|---|---|
| Soil moisture content | A daily 7-year (January 2013-December 2019) cumulative average is calculated from the daily data and it is then subjected to three times of 9-day moving averages to calculate a daily smooth average. These daily smooth averages are averaged over the period. (Half month: 1st to 15th, 16th to the end of the month, Month: 1st to the end of the month) |
| Precipitation | From the daily data, a 7-year (January 2013-December 2019) cumulative daily average is calculated, which is then subjected to three times of 9-day moving averages to calculate a daily smooth average. These daily smooth averages are then summed over the period (semi-monthly: 1st to 15th, 16th to end of month, monthly: 1st to end of month). |
| Land surface temperature | Same as the method used to calculate the normal soil moisture content. |
| Solar radiation | Same as the method used to calculate the normal soil moisture content. |
| Vegetation index | Average values are calculated from semi-monthly or monthly average data of JAXA's JASMES vegetation index (NDVI) product for a cumulative period of 7 years (January 2013 to December 2019) (semi-monthly: 1st to 15th, 16th to end of month, monthly: 1st to end of month). |
| Land Water index | Same as the method used to calculate the normal vegetation index. |
| Evapotranspiration | Same as the method used to calculate the normal vegetation index. |
a Normal value for weather and vegetation maps
The mesh-by-mesh normal values calculated by the method in Table 3 and the mesh-by-mesh current values calculated by the method in Table 4 in the next section are used to create the comparison map against the normal.
b Weather and vegetation graphs by area and time-series CSV data by area for normal years
For meshes with a cultivated land area ratio greater than 0 in each analysis area, the weighted average value is calculated by weighting the normal value for each mesh calculated by the method in Table 3 by the cultivated land area ratio, using the following formula.
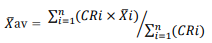
 :Time-series data normal value by area
n:Number of effective normal value meshes (Note 6) within the effective cultivated land mesh (Note 5) in the targeted area (n>0)
CRi:Percentage data of cultivated land area for each mesh (1, 2, ..., n)
 :Normal value for each mesh (1, 2, ..., n)
Current value Calculation Method[Back to top]
The current values for each period (semi-monthly: 1st to 15th, 16th to end of month, monthly: 1st to end of month) (hereinafter referred to as "current values") are calculated by averaging or adding up the data for each mesh for each data item for each period using the method shown in Table 4.(See 2(7) for the mesh of each data item.)
| Item | Method of calculating current values for each mesh |
|---|---|
| Soil moisture content | Daily data is averaged over a period of time (semi-monthly: 1st to 15th, 16th to end of month, monthly: 1st to end of month). |
| Precipitation | Daily data is summed over a period of time (semi-monthly: 1st to 15th, 16th to end of month, monthly: 1st to end of month). |
| Land surface temperature | Same as the method used to calculate the current value of soil moisture content. |
| Solar radiation | Same as the method used to calculate the current value of soil moisture content. |
| Vegetation Index | Same as the method used to calculate the current value of soil moisture content. (From September 2022 onward)
Semi-monthly or monthly average data from JAXA's JASMES vegetation index (NDVI) product is used. (Before August 2022) |
| Land Water Index | The maximum value for semi-monthly(semi-monthly: 1st to 15th, 16th to end of month, monthly: 1st to end of month) is Chosen. |
| Evapotranspiration | Semi-monthly or monthly average data from JAXA's JASMES evapotranspiration product is used |
a Current values for weather and vegetation maps
The current values for each mesh calculated by the method shown in Table 4 are color-coded on the map as they are.
b Current values of weather/vegetation graphs by area and time-series CSV data by area
For meshes with a cultivated land area ratio greater than 0 in each analysis area, the current value for each mesh calculated by the method in Table 4 is weighted by the cultivated land area ratio and calculated as a weighted average value using the following formula.
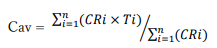
n:Number of effective current value meshes (Note 7) within the effective cultivated land mesh (Note 5) in the targeted area (n>0)
CRi:Percentage data of cultivated land area for each mesh (1, 2, ..., n)
Ti:Current value for each mesh (1, 2, ..., n)
Method of Calculating Totalized and Average Values[Back to top]
The data used to calculate the totalized and average values are semi-monthly data calculated by the method described in 2(10).
Data will not be displayed if any of the following apply.
Status of data acquisition during the update process[Back to top]
Although the current values for the most recent period are updated on the data update date, the system may not be able to obtain the satellite data file for the entire number of days for the period in question due to missing data caused by satellite operational reasons. For this reason, the number of days of satellite data that could be used in the calculation of semi-monthly current values is listed in the "Time Series CSV Data" as the "Number of days of data used".
Since the data update process is performed up to three times, including the timing of the first data update process in the period under review, the current values may change with the addition of satellite data files that can be acquired during the next and subsequent update processes.
Even when satellite data files can be obtained, mesh-by-mesh values may be missing due to cloud cover and other factors. When processing the calculation of current values, a mesh with all the daily data missing for a period of time is considered an invalid mesh and is considered a missing area, while a mesh with at least one day of daily data for a period of time is included in the calculation.
The ratio of the number of invalid meshes to the number of all valid cultivated land meshes in each analysis area is shown in the "Time Series CSV Data" as "Percentage of missing data pixels". As the "percentage of missing pixels" increases, the accuracy of the current values for the area decreases.
Each data item[Back to top]
Soil moisture content[Back to top]
Soil moisture content calculated from satellite data is the volumetric moisture content (the volume percentage of water contained in the soil in a unit volume). It corresponds to soil moisture near the ground surface at a depth of a few centimeters below the surface.
The soil moisture content provided on this site is estimated by processing calculations such as removing the effect of water content of vegetation on the ground, based on observation data from AMSR-E (onboard the U.S. Aqua satellite ) and AMSR2 (onboard the JAXA GCOM-W satellite), which are a series of JAXA's microwave radiometers onboard the U.S. Aqua satellite.
Note that there are areas where it is difficult to estimate soil moisture content due to data processing (Note 8), and such areas are shown in gray on the soil moisture content map as deficient areas during the relevant period (however, snow-covered areas are shown in pink on the soil moisture content map). In addition, the soil moisture content graph by area and time series CSV data are also missing for the relevant time period.
In some areas, observation data cannot be obtained due to radio interference. The graph of soil moisture content will not be displayed due to the lack of data in such locations.
- Under extremely dry conditions, such as deserts, they tend to be overestimated.
- In areas with extensive dense forests, such as tropical forests, or in areas with strong precipitation, the soil signals may be absorbed by the vegetation and precipitation, resulting in an apparently dry soil estimate.
Precipitation[Back to top]
Precipitation provided on this site is based on JAXA's GSMaP (Global Satellite Mapping of Precipitation). GSMaP provides hourly global precipitation distribution data using observation data from multiple satellites equipped with national and international rainfall radars, microwave radiometers, and thermal infrared sensors. (GPM-Core GMI, TRMM TMI, GCOM-W AMSR2, Defense Meteorological Satellite Program (DMSP) series SSMIS, National Oceanic and Atmospheric Administration (NOAA ) series, Advanced Microwave Sounding Unit (AMSU), Meteorological Operational Satellite (MetOp)series AMSU, Geostationary meteorological satellite, etc.
In some areas, observation data cannot be obtained due to radio interference. The graph of precipitation will not be displayed due to the lack of data in such locations.
Land surface temperature[Back to top]
Surface temperature is the temperature of the uppermost surface in contact with the atmosphere. For example, in the case of a forest, it is the temperature of the canopy surface, and on a snow-covered surface, it is the temperature of the snow surface. Note that surface temperatures cannot be calculated when the area under observation is covered by clouds. For September 2022 and beyond, the surface temperatures provided on this site are based on data from JASMES, which uses observation data from the optical sensor SGLI (mounted on JAXA's GCOM-C satellite) and is data analyzed and provided by JAXA.
If you cannot obtain observation data from SGLI, you can use MODIS (MODIS is an optical sensor). sensor MODIS (onboard the U.S. Terra satellite) during the daytime (10:30 a.m.) to compensate for the missing data. If neither observation data can be obtained, the data is deficient; before August 2022, only MODIS observation data is used.
Solar radiation[Back to top]
In the case of September 2022 and after, the solar radiation data provided on this site is based on the JASMES data provided by JAXA using the daily observation data of the optical sensor SGLI (onboard JAXA's GCOM-C satellite). If SGLI observation data cannot be obtained, data from either of the Terra or Aqua satellites are used to fill in the missing data. In the case that SGLI observation data is not available and data from either Terra or Aqua satellite is not available, the missing data is calculated as the average of daily mean values of solar radiation calculated from the MODIS observation data of each of Terra and Aqua. Prior to August 2022, only MODIS observations were used (SGLI was used only for April 2022)
Vegetation index(NDVI)[Back to top]
For September 2022 and beyond, the vegetation indices (NDVI) provided on this site are based on data from JASMES, which is data analyzed and provided by JAXA using daily observation data from the optical sensor SGLI (onboard JAXA's GCOM-C satellite). Prior to August 2022, the data are analyzed and provided by JAXA using the data of the optical sensor, MODIS (onboard the U.S. Terra and Aqua satellites), and calculated using data from "JASMES", a data analysis and provisioning service by JAXA, using daily observation data from MODIS onboard Terra and Aqua, respectively.
The vegetation index (NDVI) is between minus 1.0 and 1.0. However, since negative values are considered to be in areas such as water bodies and snow-covered areas, they are shown in gray as missing areas on the vegetation index (NDVI) map for the relevant time period (however, snow-covered areas are shown in pink on the vegetation index (NDVI) map). In addition, vegetation indices cannot be calculated if the area to be observed is covered by clouds.
In the calculation of the vegetation index (NDVI) for each analysis area, if the "percentage of missing data pixels" in the area is high due to snow cover, etc., the number of samples may be small and the representative value for the analysis area may not be calculated appropriately. For this reason, the "Percentage of Pixels with Missing Data" is considered missing if it is 80% or more.
This indicator expresses the amount and activity of plant leaves by standardizing the difference in reflectance in the red and near-infrared wavelength bands observed by satellite-mounted optical sensors, utilizing the characteristics of plant leaves that strongly reflect near-infrared sunlight and strongly absorb red light and it is calculated by the following formula.
R=spectral reflectance in the red region
Land Water Index(LWI)[Back to top]
The Land Water Index is an indicator that observes weak radio waves emitted from the Earth's surface using a microwave radiometer. It leverages the characteristic that the more water content there is and the flatter the Earth's surface becomes due to inundation, the vertical polarization becomes larger than the horizontal polarization to grasp the inundation situation.
The Land Water index (LWI) ranges between -1.0 and 1.0, and the larger the value, the more the Earth's surface is in an inundated condition.
It is calculated using the following formula from the L3 brightness temperature data (horizontal and vertical polarization at the 36GHz band) of AMSR-E and AMSR2 published by JAXA.
Brightness temperature is the observed physical quantity measured by the microwave radiometer.
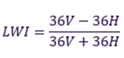
Note that 36V means "brightness temperature (vertical polarization)" and 36H means "brightness temperature (horizontal polarization).
Evapotranspiration(ET Index)[Back to top]
Here's the detailed explanation of the evapotranspiration index:
Evapotranspiration combines two processes: the evaporation of water from the Earth's surface, including the surfaces of plants, and the transpiration of water through plant stomata. Essentially, it represents the amount of water released from the surface to the atmosphere.
The evapotranspiration rate varies depending on weather conditions, land cover and its state, and soil moisture content. It is a critical physical quantity used to understand drought conditions, crop yields, and biomass.
The reference evapotranspiration is the rate calculated for a hypothetical grassland with sufficient water supply, based on weather conditions.
The larger the evapotranspiration index, the more water is available, which is essential for crop growth. Conversely, a lower value indicates less water availability, leading to drought conditions that can negatively impact crop growth.
For more detailed information on the evapotranspiration index, please refer to the resources provided by the Japan Aerospace Exploration Agency (JAXA).
https://suzaku.eorc.jaxa.jp/GCOM_C/data/files/Tasumi_ETID_ATBD_v14.pdf
Snow-covered areas[Back to top]
Snow covered area is the place covered with snow.
The snow coverage area provided on this site for September 2022 and beyond is shown in pink on the Soil Moisture Map and the Vegetation Index Map using the JASMES, which is the data provided by JAXA based on the daily observation data from the SGLI optical sensor (onboard JAXA’s GCOM-C satellite). Before August 2022, the data is shown in pink on the Soil Moisture Map and the Vegetation Index Map using the JASMES, which is the data provided by JAXA based on the observation data from MODIS‘s optical sensor onboard the two U.S. satellites, Terra and Aqua.
In the area with high elevation, low temperature and high cloud cover, it is difficult to distinguish snow cover. Therefore, there will be the false case to display snow covered area even tropical areas where there is no snow cover.
Data of yield etc.[Back to top]
Data of unit yield and other data refer to planted area of crops, production volume, and unit yield.
PSD's Area Harvested is used for planted area of crops, PSD's Production for production, and PSD's Yield for unit yield.
Please note that since PSD data is updated from time to time, the latest data may not be reflected in JASMAI. In particular, please note that JASMAI updates its data by U.S. state only once a year.
If the target crop is not planted in the selected area, the graph on yield etc. will not be displayed.
Alternative data in graph of weather and vegetation by area[Back to top]
In the graph of weather and vegetation by area, the soil moisture and precipitation cannot be calculated by satellite data for some areas of Southeast Asia due to their small area. For this reason, for the following nine areas, soil moisture and precipitation are taken from adjacent areas.
|
▶ |
|
||||||||||||||||||||||||||||||||||||||||||||||||||||||||||||||||||
※Data replaced by red location
Usage Notes[Back to top]
Disclaimer[Back to top]
The purpose and method of use of this site are left to the discretion and responsibility of the user, and neither MAFF nor JAXA will be involved in any way.
The user shall be solely responsible for any and all damages incurred by the user or any third party as a result of using this site for any reason whatsoever, and neither MAFF nor JAXA shall be liable for any such damages.
Description of the source[Back to top]
When using images and data from this site, please clearly indicate the source as follows
【How to clearly indicate the source of the information when using them】
- Soil moisture contentMinistry of Agriculture, Forestry and Fisheries "Japan's Satellite Monitoring system of Agrometeorological Information"
(Created by processing JAXA's "AMSR2/AMSR-E Soil Moisture Product") - Soil moisture + snow cover areaMinistry of Agriculture, Forestry and Fisheries "Japan's Satellite Monitoring system of Agrometeorological Information"
(Prepared by processing JAXA "AMSR2/AMSR-E Soil Moisture Product" and JAXA "Snow/Ice Area Product") - PrecipitationMinistry of Agriculture, Forestry and Fisheries "Japan's Satellite Monitoring system of Agrometeorological Information"
(Created by processing JAXA's GSMaP precipitation product) - Surface temperatureMinistry of Agriculture, Forestry and Fisheries "Japan's Satellite Monitoring system of Agrometeorological Information"
(Created by processing JAXA's "Surface Temperature Product") - Solar radiationMinistry of Agriculture, Forestry and Fisheries "Japan's Satellite Monitoring system of Agrometeorological Information"(processed from JAXA's "Shortwave Radiation Product")
- Vegetation index (NDVI)Ministry of Agriculture, Forestry and Fisheries "Japan's Satellite Monitoring system of Agrometeorological Information"
(Vegetation index (NDVI) (Created by processing JAXA's "Vegetation index (NDVI) product") - Vegetation index (NDVI) + snow cover areaMinistry of Agriculture, Forestry and Fisheries "Japan's Satellite Monitoring system of Agrometeorological Information"
(Created by processing JAXA's "Vegetation Index (NDVI) Product" and JAXA's "Snow and Ice Area Product") - Trends in Unit Yield, etc.Ministry of Agriculture, Forestry and Fisheries "Japan's Satellite Monitoring system of Agrometeorological Information"
(Created by processing USDA “PS&D”) - Land Water Index(LWI)Ministry of Agriculture, Forestry and Fisheries "Japan's Satellite Monitoring system of Agrometeorological Information"
(Created by processing JAXA "AMSR2/AMSR-E Brightness Temperature Product".) - Evapotranspiration(ET)Ministry of Agriculture, Forestry and Fisheries "Japan's Satellite Monitoring system of Agrometeorological Information"
(Created by processing JAXA "AMSR2/AMSR-E Evapotranspiration Product".)
Acquisition of information from browsing this site, etc.[Back to top]
This site automatically obtains IP addresses and other information such as users’ browsing this site.
“Google Analytics" is used to collect and analyze access logs.
Google Analytics uses cookies to collect information about users, but does not collect information that identifies individual users. Information collected by Google Analytics is governed by Google's Privacy Policy. For more information, please click here to view the Google Privacy Policy (external link).
About Cookies[Back to top]
This site uses cookies.
Cookies are exchanged between the site's server and the user's browser when the user accesses the site and are stored on the user's computer.
Users can refuse the collection of access logs by selecting to disable cookies in their browser settings.
Please note that disabling cookies will not affect your ability to browse our Web site. For information on how to set up your browser, please refer to the help page of your browser or contact the manufacturer.
Related Links[Back to top]
| JAXA Earth Observation Research Center(EORC) | https://www.eorc.jaxa.jp/en/index.html |
| JAXA "Earth Observation Satellite Data Distribution System (Globe Portal Data system)(G-Portal)" | https://gportal.jaxa.jp/gpr/?lang=en |
| JAXA "AMSR/AMSR-E" | https://sharaku.eorc.jaxa.jp/AMSR/index.html |
| JAXA "GCOM-W" | https://suzaku.eorc.jaxa.jp/GCOM_W/index.html |
| JAXA "Global Satellite Mapping of Precipitation"(GSMaP) | https://sharaku.eorc.jaxa.jp/GSMaP/index.htm |
| JAXA "climate-forming physical quantity Data Set"(JASMES) | https://kuroshio.eorc.jaxa.jp/JASMES/index.html |
| NASA「LP-DAAC」 | https://lpdaac.usgs.gov/ |
| USDA「Global Crop Production Maps by Region」 | https://ipad.fas.usda.gov/rssiws/al/global_cropprod.aspx |
| USDA「PSD Online」 | https://apps.fas.usda.gov/psdonline/app/index.html |
| USDA「Quick Stats」 | https://quickstats.nass.usda.gov/ |